Diabetes Education

CGM Data and Cardiovascular Care: What It Can and Cannot Tell You

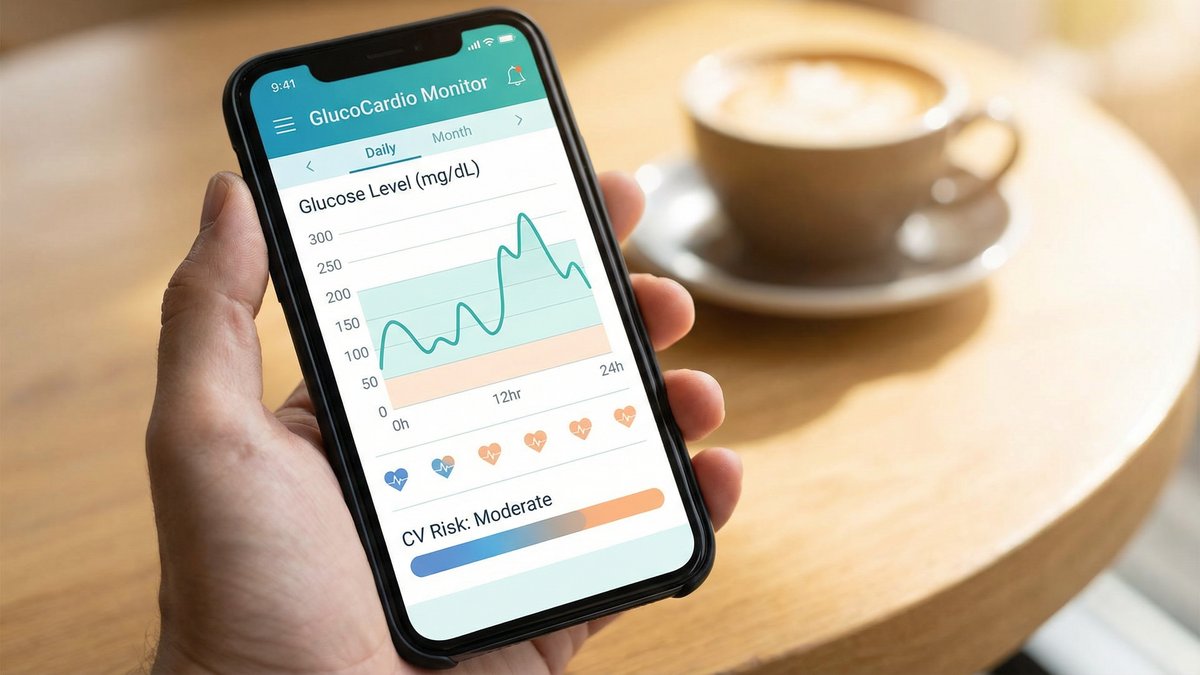
CGM can show glucose patterns that support diabetes care conversations, but it does not diagnose heart disease.

Short summary: Continuous glucose monitoring can show patterns that A1C misses, including time in range, time above range, time below range, and glucose variability. Those patterns can support safer diabetes care, but they do not diagnose heart disease or replace standard cardiovascular risk assessment.

Advertisement

Key takeaways

  • CGM can help people and clinicians see daily glucose patterns that A1C averages may hide.
  • Time in range is a practical metric, but it should be interpreted with hypoglycemia, medications, age, pregnancy, and overall health in mind.
  • Cardiovascular care still requires blood pressure, cholesterol, kidney function, smoking status, family history, symptoms, and other clinical information.

What CGM adds beyond A1C

A1C estimates average glucose over about three months. It is useful, but it cannot show whether glucose is steady, frequently high after meals, or dropping low overnight. CGM fills in that daily pattern.

The ADA describes CGM as a diabetes technology that helps with glucose tracking and therapy decisions. The international Time in Range consensus recommends looking at time in range, time below range, time above range, glucose management indicator, and glucose variability rather than relying on one number.

How glucose patterns fit into cardiovascular care

Advertisement

Long-term high glucose is linked with blood vessel damage. Large glucose swings and repeated high readings may also reflect glucose-management stress, although CGM metrics are not a stand-alone cardiovascular screening test.

For people with diabetes, cardiovascular care usually considers several factors together: age, blood pressure, cholesterol, kidney disease, smoking, albumin in the urine, duration of diabetes, family history, symptoms, and existing heart or blood vessel disease. CGM can add useful glucose context, but it cannot replace those measures.

CGM metrics worth discussing

Time in range: The percentage of time glucose is in the target range chosen by the care team. Many non-pregnant adults use 70 to 180 mg/dL as a common range, but targets can differ for pregnancy, older adults, children, people at high hypoglycemia risk, and people with other health conditions.

Time below range: Time spent low. This is especially important for people using insulin or medicines that can cause hypoglycemia.

Time above range: Time spent high. Patterns after meals, overnight, or during stress can guide safer changes.

Glucose variability: How much glucose swings up and down. Very high variability may suggest mismatched meals, medication timing, activity, illness, sleep disruption, or other factors.

What this does not mean

A CGM graph cannot tell you that your arteries are blocked. It cannot replace a blood pressure check, lipid panel, kidney testing, smoking review, or evaluation for chest pain, breathlessness, leg symptoms, or stroke warning signs.

CGM readings can also be inaccurate at times. The ADA recommends access to blood glucose monitoring for people using CGM, especially when symptoms do not match sensor readings, during rapid glucose changes, or when a device issue occurs.

For practical help, see our guides to CGM for beginners, reading CGM graphs, and heart rate variability and blood sugar.

Practical takeaway

Use CGM as a pattern tool, not a heart-disease diagnosis tool. Bring your time in range, time below range, overnight patterns, and after-meal patterns to diabetes visits, and ask how they fit with your blood pressure, cholesterol, kidney results, symptoms, and overall cardiovascular care plan.

Sources

Editorial review note: reviewed for medical accuracy, source consistency, patient-safety framing, technology caveats, and plain-language readability before publication.

Spread the love
Advertisement

Leave a comment