How to Read CGM Graphs Like a Pro
Continuous Glucose Monitors (CGMs) have revolutionized diabetes management by providing real-time glucose data. But understanding all those lines, arrows, and patterns can feel overwhelming at first. This guide will transform you from a CGM novice to someone who can confidently interpret your glucose data, spot trends, and make informed decisions about your diabetes management.
If you’ve recently started using a Continuous Glucose Monitor (CGM), congratulations! You’ve taken a significant step toward better understanding your body’s unique response to food, activity, medication, and other factors that influence your glucose levels. However, those colorful graphs and constant data streams can initially seem like a foreign language.
The good news is that with some guidance and practice, you’ll soon be interpreting your CGM data with confidence. Let’s break down everything you need to know to read CGM graphs like a seasoned pro.
Understanding the Basics: What You’re Looking At
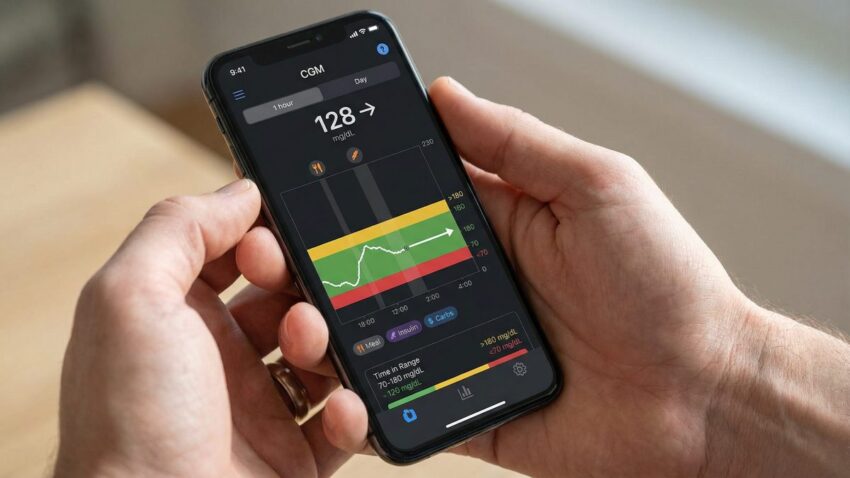
Most CGM systems display your glucose data on a graph with time on the horizontal axis and glucose values on the vertical axis. This visual representation allows you to see your glucose levels throughout the day and how they change in response to various factors.
The main elements you’ll see on a typical CGM graph include:
- Current glucose reading (the most recent measurement)
- Historical glucose readings (usually displayed as a continuous line)
- Target range (often highlighted as a green or gray band)
- High and low thresholds (lines or colored zones indicating values above or below your target range)
- Trend arrows (indicating the direction and rate your glucose is changing)
- Event markers (for meals, insulin, exercise, etc.)
ℹ️ Did You Know?
Most CGMs take readings every 5 minutes, providing 288 glucose readings per day! This is dramatically more information than the 4-7 daily readings you might get with traditional fingerstick monitoring, giving you a much more complete picture of your glucose patterns.
Decoding Trend Arrows: Your Glucose’s Direction and Speed
Trend arrows are one of the most valuable features of CGM systems. These arrows indicate not just whether your glucose is rising or falling, but how quickly the change is happening. While the exact meanings vary slightly between different CGM brands, here’s a general guide:
| Arrow Direction | What It Means |
|---|---|
| ↑ (Single up arrow) | Rising moderately (1-2 mg/dL per minute) |
| ↑↑ (Double up arrow) | Rising rapidly (more than 2 mg/dL per minute) |
| → (Horizontal arrow) | Relatively stable (less than 1 mg/dL per minute change) |
| ↓ (Single down arrow) | Falling moderately (1-2 mg/dL per minute) |
| ↓↓ (Double down arrow) | Falling rapidly (more than 2 mg/dL per minute) |
Understanding trend arrows helps you make proactive decisions. For example, if your glucose is 90 mg/dL but dropping rapidly (↓↓), you might need a small snack to prevent hypoglycemia. Conversely, if your glucose is 200 mg/dL but relatively stable (→), you might handle this differently than if it were 200 mg/dL and rising quickly (↑↑).
✅ Practical Tip
Don’t react to every small fluctuation in your CGM readings. Look for consistent patterns over 15-30 minutes before making treatment decisions. This helps avoid “over-correcting,” which can lead to glucose roller coasters.
Identifying Common Patterns and What They Mean
One of the most powerful aspects of CGM data is the ability to identify recurring patterns in your glucose levels. Here are some common patterns and what they might indicate:
The Overnight Patterns
Steady overnight line: This is ideal! It suggests your basal insulin (if you use it) is well-matched to your overnight needs.
Dawn phenomenon: A rise in glucose levels between approximately 4-8 AM, even without eating. This is caused by morning hormones (cortisol, growth hormone) that naturally increase insulin resistance.
Nocturnal hypoglycemia: Dips in glucose during sleeping hours that may go unnoticed without a CGM. If you wake up with a headache or feeling unusually tired, check if your CGM shows overnight lows.
Mealtime Patterns
Steep post-meal spikes: Sharp increases after eating may indicate that your meal contained rapidly-absorbed carbohydrates, your meal insulin timing needs adjustment, or your carb counting might be off.
Delayed peaks: If your glucose peaks 2-3 hours after eating rather than 1-2 hours, you might be seeing the effects of high-fat meals, which can delay carbohydrate absorption.
Post-meal crashes: A rapid rise followed by a sharp drop below your target range might indicate too much mealtime insulin or poor timing of insulin relative to your meal.
Activity Patterns
Exercise drops: Decreases during or shortly after physical activity are common as exercise increases insulin sensitivity.
Post-exercise rises: Sometimes intense exercise can cause glucose to rise temporarily due to the release of stress hormones.
Delayed exercise effect: Increased insulin sensitivity can last for hours after exercise, sometimes causing unexpected lows later in the day or overnight.
Time in Range: The Modern Metric That Matters
While A1C remains an important long-term measure, diabetes management is increasingly focusing on “Time in Range” (TIR) — the percentage of time your glucose levels stay within your target range (typically 70-180 mg/dL, though your healthcare provider might recommend a different range for you).
Most CGM systems and their companion apps will calculate your TIR automatically, often displaying it as a pie chart or percentage. Generally, the goal for most adults with diabetes is to spend at least 70% of time in range, less than 4% below range, and less than 25% above range.
TIR gives you a more nuanced picture of your glucose management than A1C alone, as it captures both the highs and lows that might be “averaged out” in an A1C result.
ℹ️ Did You Know?
Each 10% improvement in Time in Range is associated with meaningful benefits for long-term health outcomes. Even small improvements in TIR can make a difference in how you feel day-to-day and in your long-term health.
Advanced Analysis: Glucose Variability
Beyond just looking at average glucose or time in range, the variability or “bounciness” of your glucose levels is increasingly recognized as important. High glucose variability (many ups and downs) may contribute to complications even if your average glucose seems acceptable.
Most CGM systems calculate a metric called the “coefficient of variation” (CV) or standard deviation to measure this variability. Generally, a CV below 36% is considered stable glucose control.
Visually, you can assess variability by looking at how “jagged” your CGM graph appears. A smoother line with gentle slopes is preferable to a line with many sharp peaks and valleys.
Using the Ambulatory Glucose Profile (AGP) Report
Many CGM systems can generate an Ambulatory Glucose Profile (AGP) report, which compiles data from multiple days (typically 14) to show your typical glucose patterns.
The AGP displays:
- A median (middle) line showing your typical glucose value at each time of day
- Shaded areas showing where your glucose values typically fall 50% and 90% of the time
- Statistics on your time in range, glucose variability, and average glucose
This report is extremely valuable for identifying recurring patterns and can help you and your healthcare provider make more informed adjustments to your treatment plan.
✅ Practical Tip
Keep a digital or paper food and activity log for at least a week while using your CGM. Match this information with your CGM data to identify specific foods, meal timing approaches, or activities that work well (or don’t work well) for your glucose management. This personalized information is invaluable!
Troubleshooting Common CGM Reading Issues
Sometimes your CGM may show readings that don’t seem to match how you feel or what a fingerstick reading shows. Possible causes include:
- Sensor compression: Pressure on the sensor (like sleeping on it) can cause falsely low readings
- Dehydration: Can affect the accuracy of readings
- First 24 hours: Many sensors are less accurate during the first day after insertion
- Rapid changes: During times of quick glucose changes, there may be a lag between blood glucose and the interstitial fluid that the CGM measures
If your CGM reading doesn’t match your symptoms, always verify with a fingerstick blood glucose check before taking action, especially if you’re considering taking insulin or treating a low.
✅ Key Takeaway
Reading CGM graphs effectively is about looking beyond individual numbers to understand patterns, trends, and the story your glucose data is telling. Focus on time in range rather than perfect numbers, use trend arrows to make proactive decisions, and look for recurring patterns that can guide adjustments to your food choices, activity, and medication timing. With practice, your CGM will become an invaluable tool that helps you make more informed decisions about your diabetes management.
Disclaimer: The information provided in this article is for educational purposes only and should not replace professional medical advice. Always consult with your healthcare team before making changes to your diabetes management plan.